
TGA Plots Mass Loss Interpretation and ODT
 Thermogravimetric analysis TGA is a widely used thermal technique routinely used in all phases of research, quality control, and production operations. It measures the changes in material mass as a function of temperature or time during heating in a controlled environment. The main uses include measurement of a material thermal stability and composition like volatiles and inorganic filler materials. The technique is extremely valuable in the study of all types of polymers where the materials are characterised in terms of their characteristic decomposition patterns. TGA is also used to characterise solid or liquid fuels.
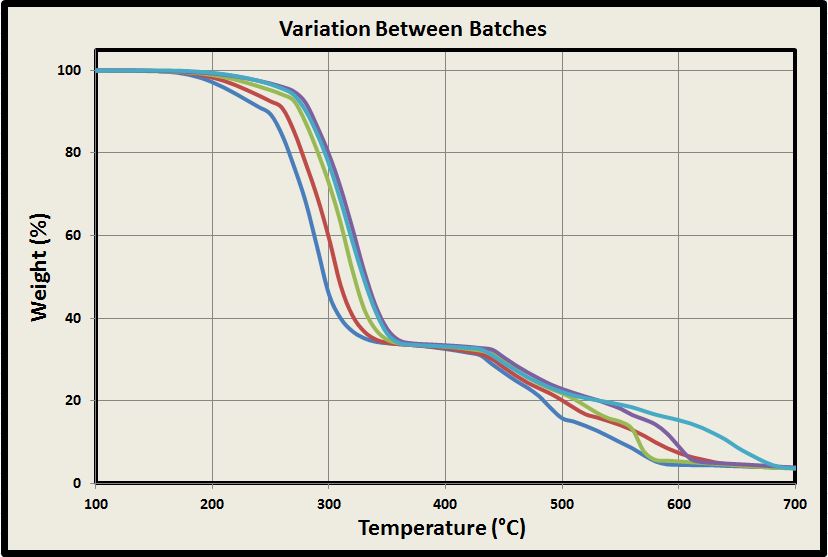
The TGA plot is an overlay of thermograms of the same type of polymer from different manufactured batches showing variations. It demonstrates an example of where TGA is a valuable tool to check that materials conform to set decomposition requirements.
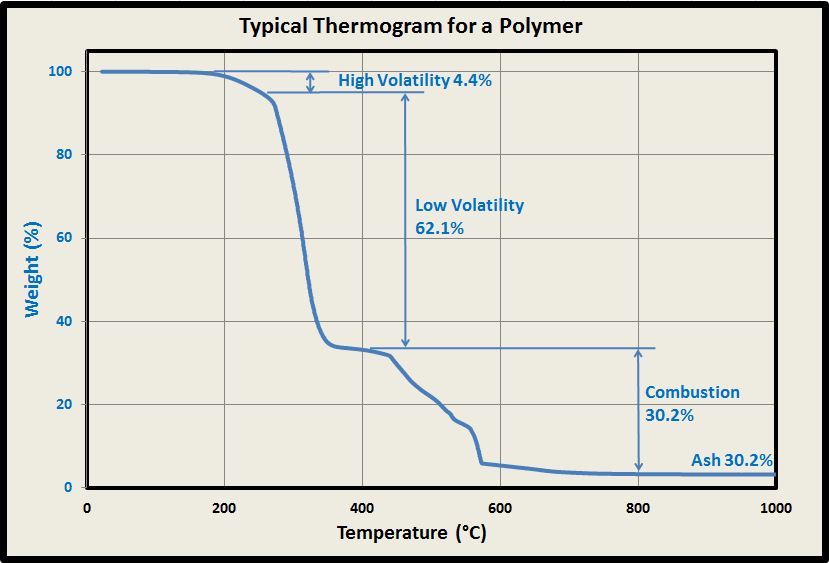
TGA Thermogram Interpretation
For polymers and rubbers TGA thermal decomposition thermogram generally follow similar patterns for 4 steps:
- The high volatility first weight loss step is due to the loss of plasticisers from the polymer.
- The low volatility second step weight loss is due to degradation of the residual polymer.
- Weight loss in the third step occurs due to combustion of compounds such as residual carbon from polymer breakdown or burn off of carbon black filler.
- The residue value is the remaining ash due to inorganic filler materials that were present in the material.
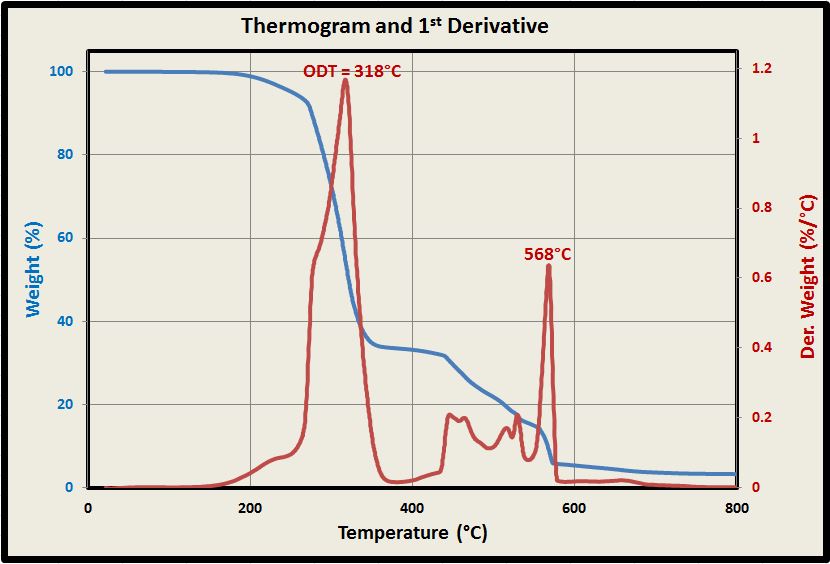
Optimum Degradation Temperature ODT by TGA
Determining the first derivative of the weight change with respect to temperature will reveal at which temperatures the maximum rates of weight change occur. The optimum degradation temperature ODT is the temperature at which the maximum degradation rate is observed for the main degradation step, as shown in the TGA ODT plot. The ODT is used as a measure of the material thermal stability.